Thank You for 10 Years of Sharing Your Voice
Use the Interpreting Survey Results Guide below as a step-by-step fillable PDF worksheet to analyze your engagement data and prepare for the next steps.
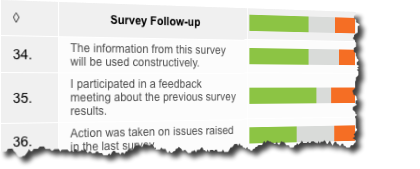
Three survey follow-up items were added to the survey in 2014 to provide an indication about employee perceptions on whether they had participated in a feedback session around the survey results, whether they had seen action taken on survey results, and whether they felt the results would be used constructively.
The reason these questions are important is the tendency for engagement to decline when employees perceive their input has been ignored or discounted. Knowing your employees’ perceptions gives you another place to start in action planning.
It is important to provide ongoing communication of progress around the steps taken to share results and take action. Often employees do not realize - or may forget - that actions taken to improve the work environment were a direct result of the feedback provided in the survey. For this reason, it is also important to provide a summary of all actions taken to support employee engagement prior to the next survey administration.
Frequently Asked Questions
How is the Employee Engagement profile generated?
The Employee Engagement profile is generated based on an algorithm/equation run by the vendor that takes the scores for an individual employee on the specific survey questions under Commitment and Dedication and Effective Environment and then compares them to an external (general industry) norm to decide where to put them in the quadrants.
I work on the Twin Cities campus. Where is the campus comparator data for my work group?
For the Twin Cities campus, this comparison will be for those whose senior leader reports to either Executive Vice President and Provost Croson or Senior Vice President of Finance and Operations Frans. This comparison will not be available for Twin Cities staff whose senior leader reports to Interim President Ettinger. Refer to page seven of the "Interpreting Survey Results" guide for an explanation of the campus comparators.”
Please explain how this survey item is scored: "Given your choice, how long would you plan to continue working for the University of Minnesota (your campus)?"
An unfavorable response is "less than 1 year and 1–2 years", a neutral response is "3–5 years", and a favorable response is "more then 5 years or until retirement."
Why do I have dashes instead of numbers in my data?
Where there are less than five respondents for any question dashes will appear instead of data. Trend data is not available for all leaders and will appear as dashes when unavailable.
How do I know if my favorable scores are high enough? When should I be concerned that my unfavorable scores are too high?
The following guidelines are provided to help interpret percentage scores:
- Favorable rating of more than 70% - Clearly favorable
- Favorable rating between 60% and 70% - Moderately favorable
- Neutral rating higher than 20% - Potential for converting to favorable responses with more information/discussion
- Unfavorable rating of more than 20%Potential warning sign
- Unfavorable rating of more than 30% - An area for further discussion and possible action.
When you have a small group of people in your unit, (10 or Less) you need to consider the practical significance of the percentage favorable differences. When you see large percentages in small units it is important to consider the actual number of employees within those ranges since one or two employee responses could have a large impact in the overall distribution.
Please refer to Interpreting Survey Results video for an explanation of how to understand your scores in the context of the overall N size of your work group.